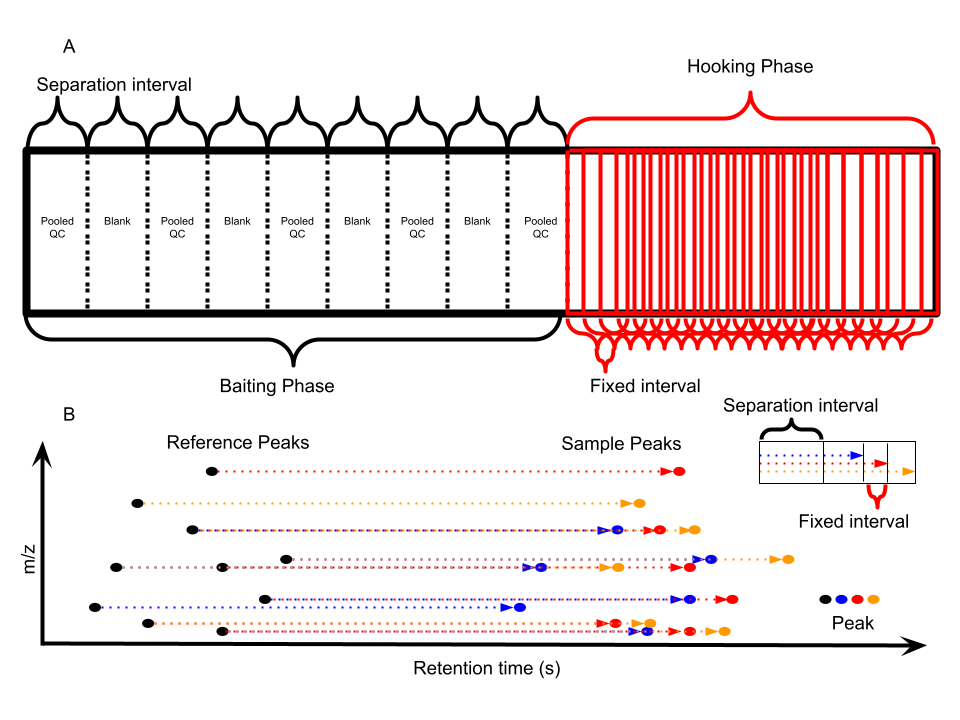
The sfi package provides features extraction tools for single file injections(sfi) mode liquid chromatography-mass spectrometry (LC-MS) data. The SFI technique enables the analysis of numerous samples (e.g., up to 1000 per day) by acquiring data from multiple injections within a single analytical run, significantly reducing the time compared to traditional serial LC-MS injections.
The SFI method (see demo figure) operates by:
Injecting a pooled sample multiple times initially to establish reference chromatographic profiles.
Subsequently injecting individual samples repeatedly at fixed, short time intervals under a continuous isocratic elution. Each sample undergoes a fixed chromatographic separation.
This process generates a single, continuous data file containing the interleaved data from all injected samples.
if (!requireNamespace("BiocManager", quietly = TRUE))
    install.packages("BiocManager")

# Install from Bioconductor (when available)
BiocManager::install("sfi")

# Or install the development version from GitHub
# remotes::install_github("yufree/sfi")
library(sfi)
You need to convert the raw data into mzML file. You might try ThermoFlask for Thermo data or ProteoWizard for other vendor file. getmzml function will load the mzML file and return a matrix object for peak picking.
path <- 'sfi.mzML'
peak <- getmzml(path)
You could use demo data in the package.
# load demo data
data(sfi)
# perform peaks picking
peaklist <-  find_2d_peaks(mz=sfi$mz,rt=sfi$rt,intensity=sfi$intensity)
The getsfm() function will extract sample features from one injections file.
mz <- peaklist$mz
rt <- peaklist$rt
intensity <- peaklist$intensity
# injection interval
idelta <- 80
# time windows for a full separation
windows <- 900
# sample numbers in the files
n <- 100
# retention time shift in seconds
deltart <- 10
# min peak number in pooled qc samples
minn <- 6
# align peaks from sfi
ndf <- getsfm(mz,rt,intensity,idelta=idelta,windows=windows,n=100,deltart = 10,minn = 6)
# generate feature list
ndf$peakid <- paste0(round(ndf$qcmz,4),'@',round(ndf$qcrt))
nndf <- ndf[,c('sampleidx','intensity','peakid')]
library(data.table)
feature <- dcast(setDT(nndf), ... ~ sampleidx, value.var = "intensity",fun.aggregate = sum)
Save feature list as csv file.
# save feature as csv file
fwrite(feature,'featurelist.csv')