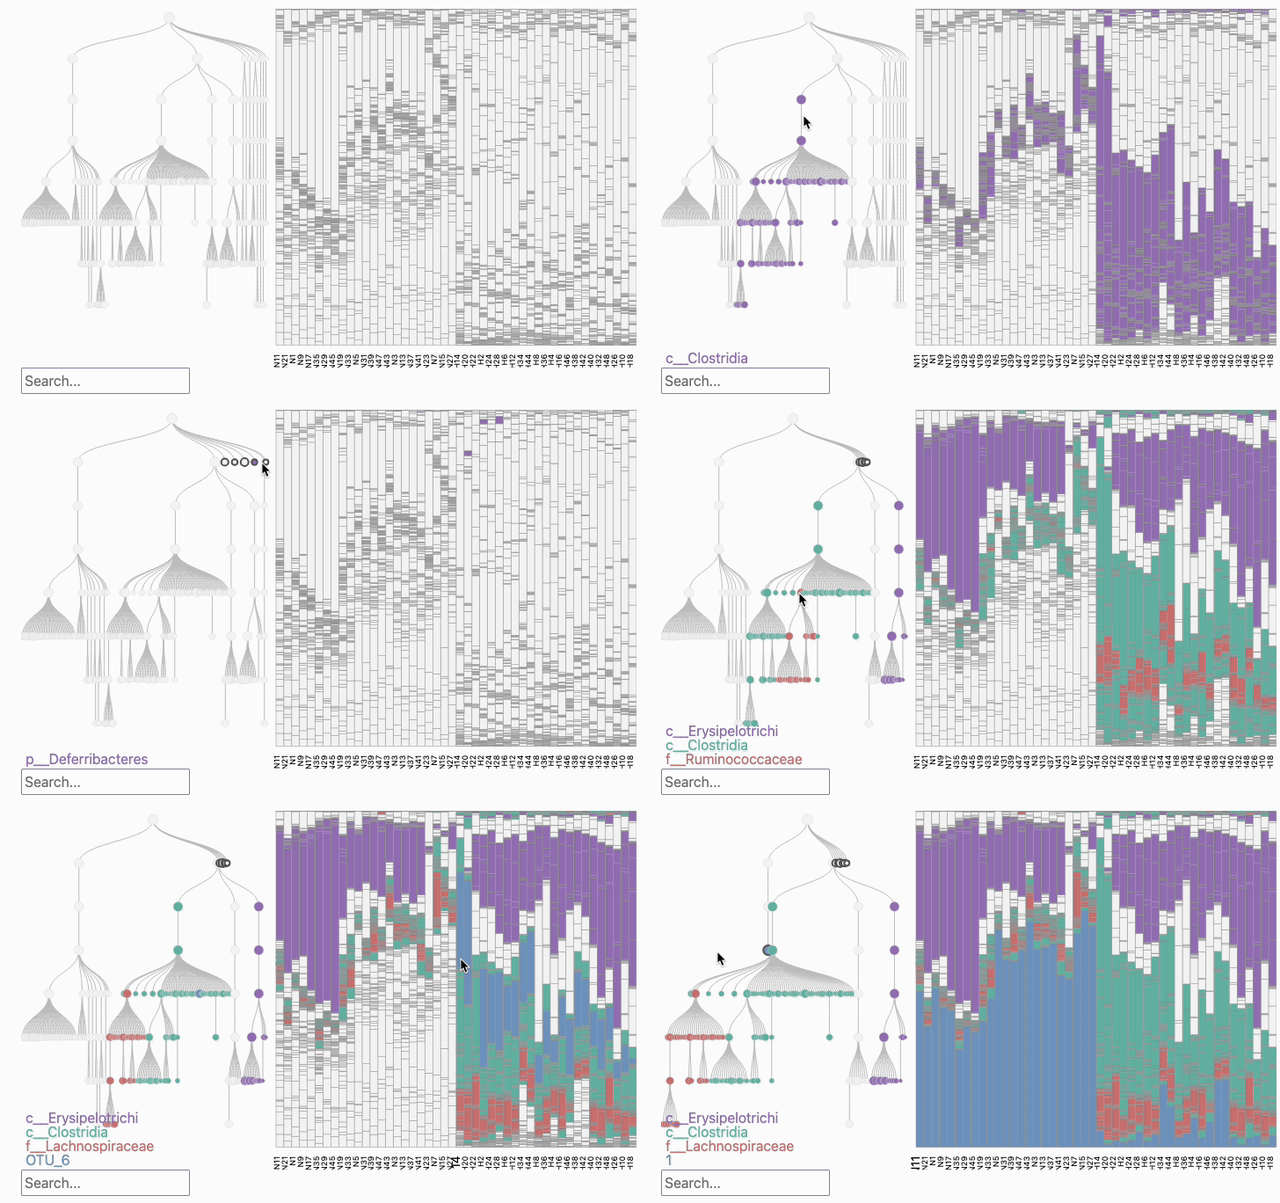
phylobar is a visualization package for constructing stacked barplots by interactively “painting” an associated tree. This is an alternative to defining a color palette at a fixed taxonomic resolution. It also helps avoid the issue of grouping all rare taxa into a color for “other” — you can selectively highlight specific rare taxa while leaving others at their background color.
The main function, phylobar, takes two inputs: a table of potentially normalized counts and a tree structure which can come from either a phylogeny or a table of taxonomic assignments. The vignettes show how to convert alternative data formats (e.g., phyloseq) into this input format. You can export interactive snapshots to SVG using the SVG crowbar package, as shown in the “Exporting Views” vignette. You can read more about the package in our preprint:
You can install phylobar from Bioconductor using:
if (!require("BiocManager", quietly = TRUE))
    install.packages("BiocManager")

BiocManager::install("phylobar")
Alternatively, you can install the development version from GitHub:
remotes::install_github("mkdiro-o/phylobar")
This block applies phylobar to a small random data set:
library(ape)
library(phylobar)

tree <- rtree(20)
samples <- matrix(rpois(100 * 20, 1), 100, 20)
phylobar(samples, tree)
You can click a node to collapse a subtree, press the control key to add a new color, and press the escape key to freeze the view. If you want to try some examples right away, we have precompiled articles. Here’s a recording of interactions with the HFHS data.
The full function reference can be found here: https://mkdiro-o.github.io/phylobar/reference/index.html.
Additional vignettes provide fully developed examples for quality control, cross group comparison, and longitudinal analysis. The package design follows the focus-plus-context principle in data visualization – our paper provides an in-depth discussion. The package is implemented using the htmlwidgets package for R-JavaScript integration. The JavaScript code is available on npm as phylobar-js.
You can reach us by creating an Issue or emailing ksankaran@wisc.edu. We appreciate your interest and will respond promptly.