


Interactive differential expression analysis & visualization for count data.
DEBrowser turns RNA-Seq differential expression analysis into an interactive, point-and-click workflow. It wraps three established Bioconductor engines — DESeq2, edgeR, and limma — in a Shiny app, so changing a cutoff, a normalization method, or a comparison re-draws every plot and table in real time. No code required to explore your results; full reproducibility exports when you're done.
📖 Full user guide: the complete, screenshot-by-screenshot walkthrough lives at debrowser.readthedocs.io. It is hosted outside the package to keep the package itself small.
1–6 / T keyboard shortcuts.# From Bioconductor (release)
if (!requireNamespace("BiocManager", quietly = TRUE))
install.packages("BiocManager")
BiocManager::install("debrowser")
library(debrowser)
startDEBrowser()
startDEBrowser() opens the app in your browser on port 3838 (so bookmark
URLs stay stable across restarts). See
Operating system dependencies if system
libraries are missing.
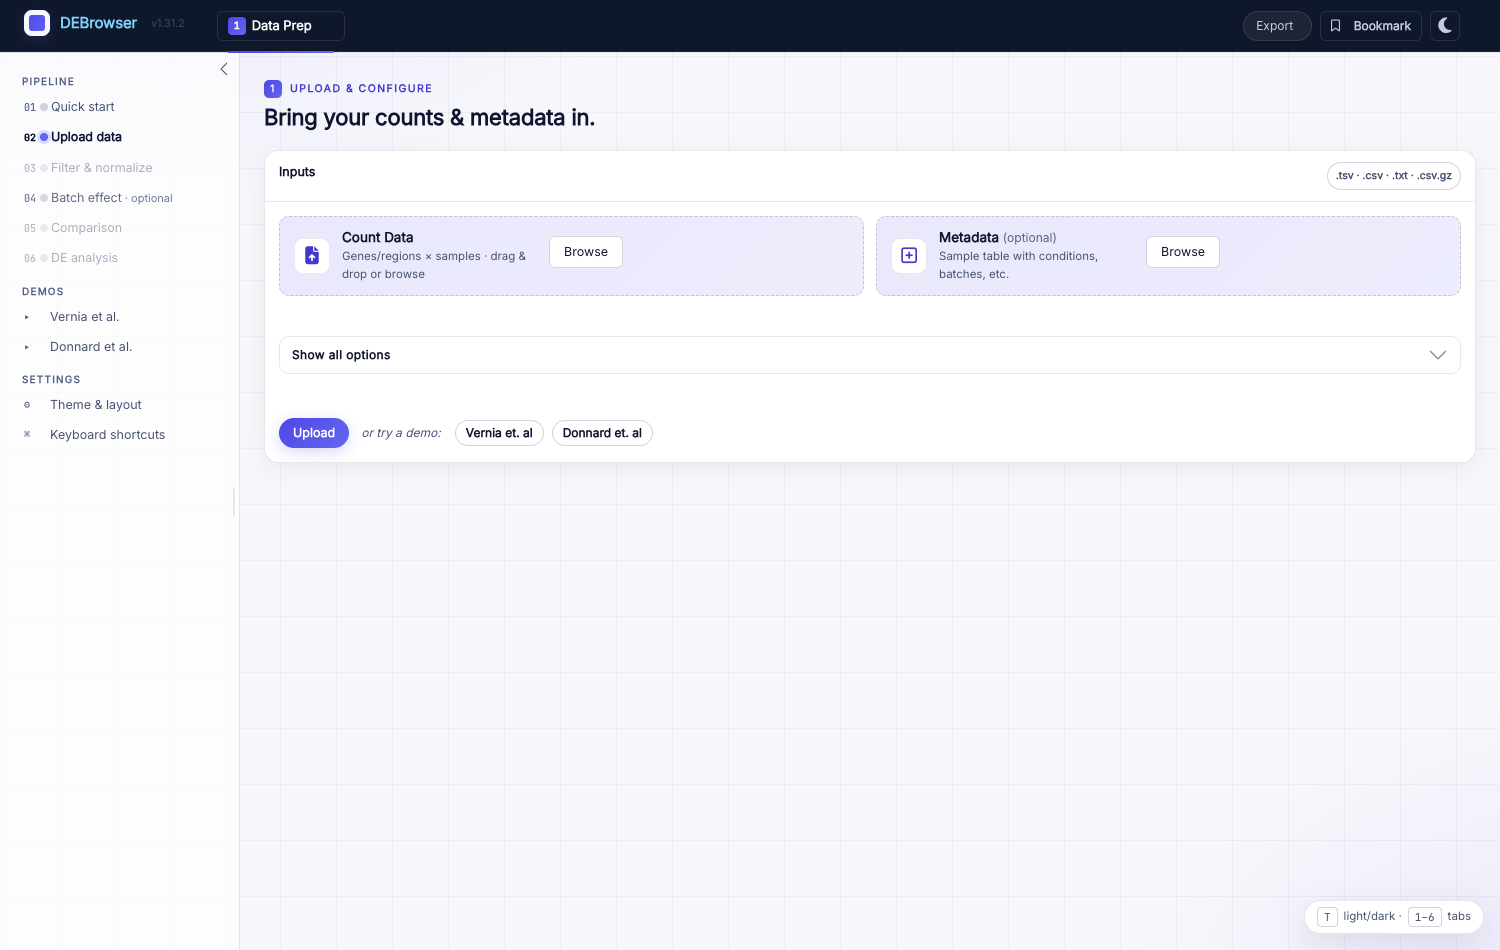
New to DEBrowser? Click Vernia et al. under Demos on the Upload step, then Upload, to walk the whole pipeline on bundled data.
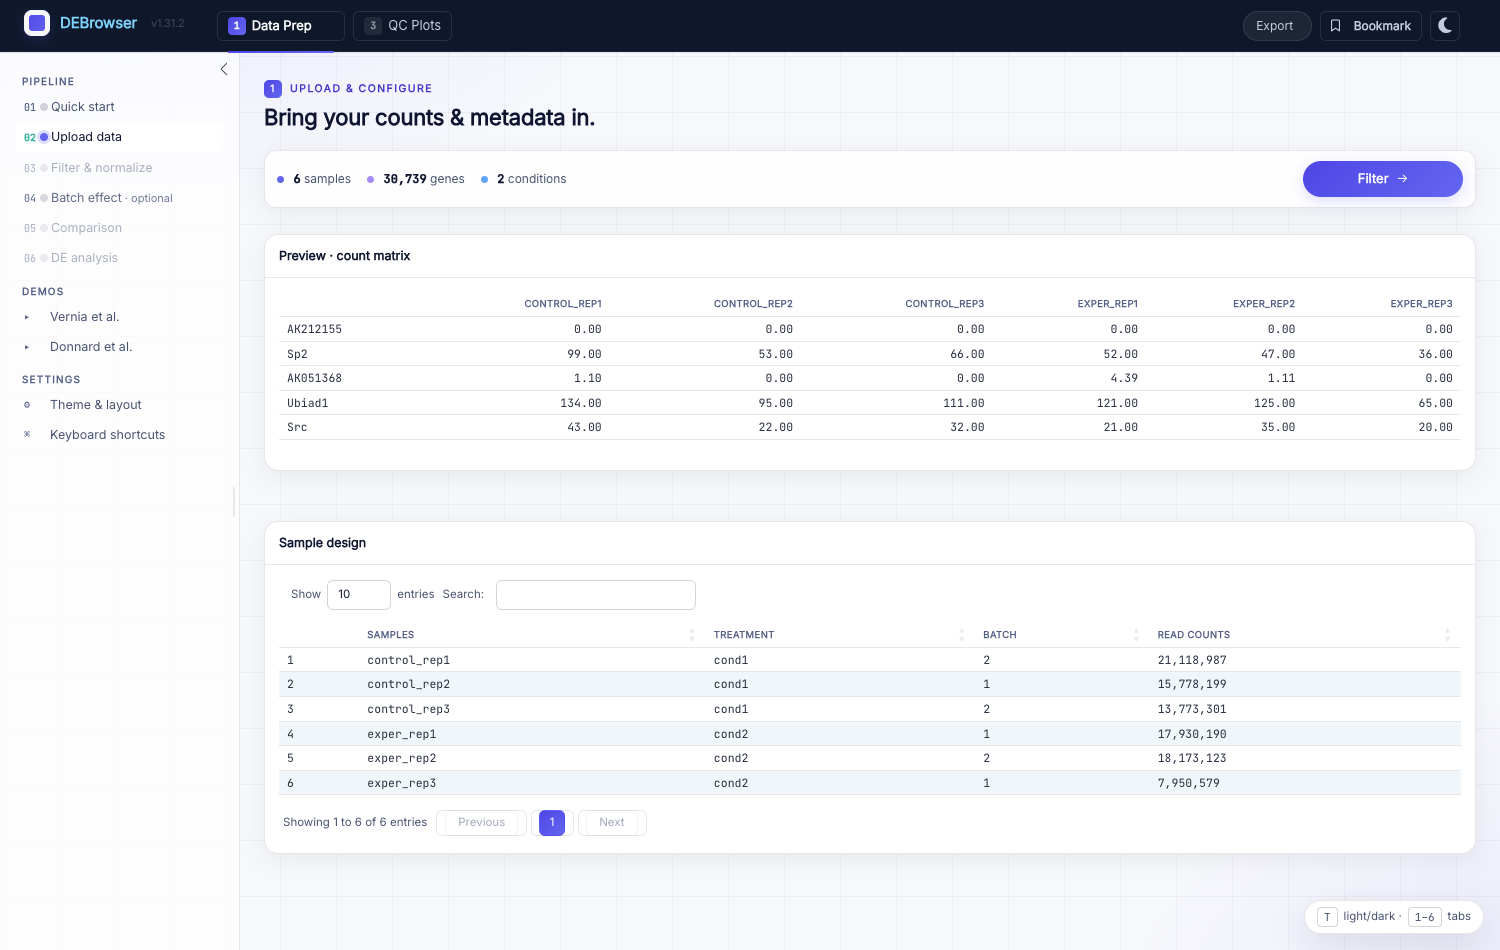
Drop in a count matrix (genes in the first column, one raw-count column per
sample) and, optionally, a metadata table mapping samples to conditions and
batches. DEBrowser accepts .csv / .tsv / .txt / .csv.gz. On upload it
shows a summary — samples, genes, conditions — plus a preview and the
sample-design table.
DESeq2 needs un-normalized counts (it models library size internally). Use pre-normalized values only with edgeR or limma.
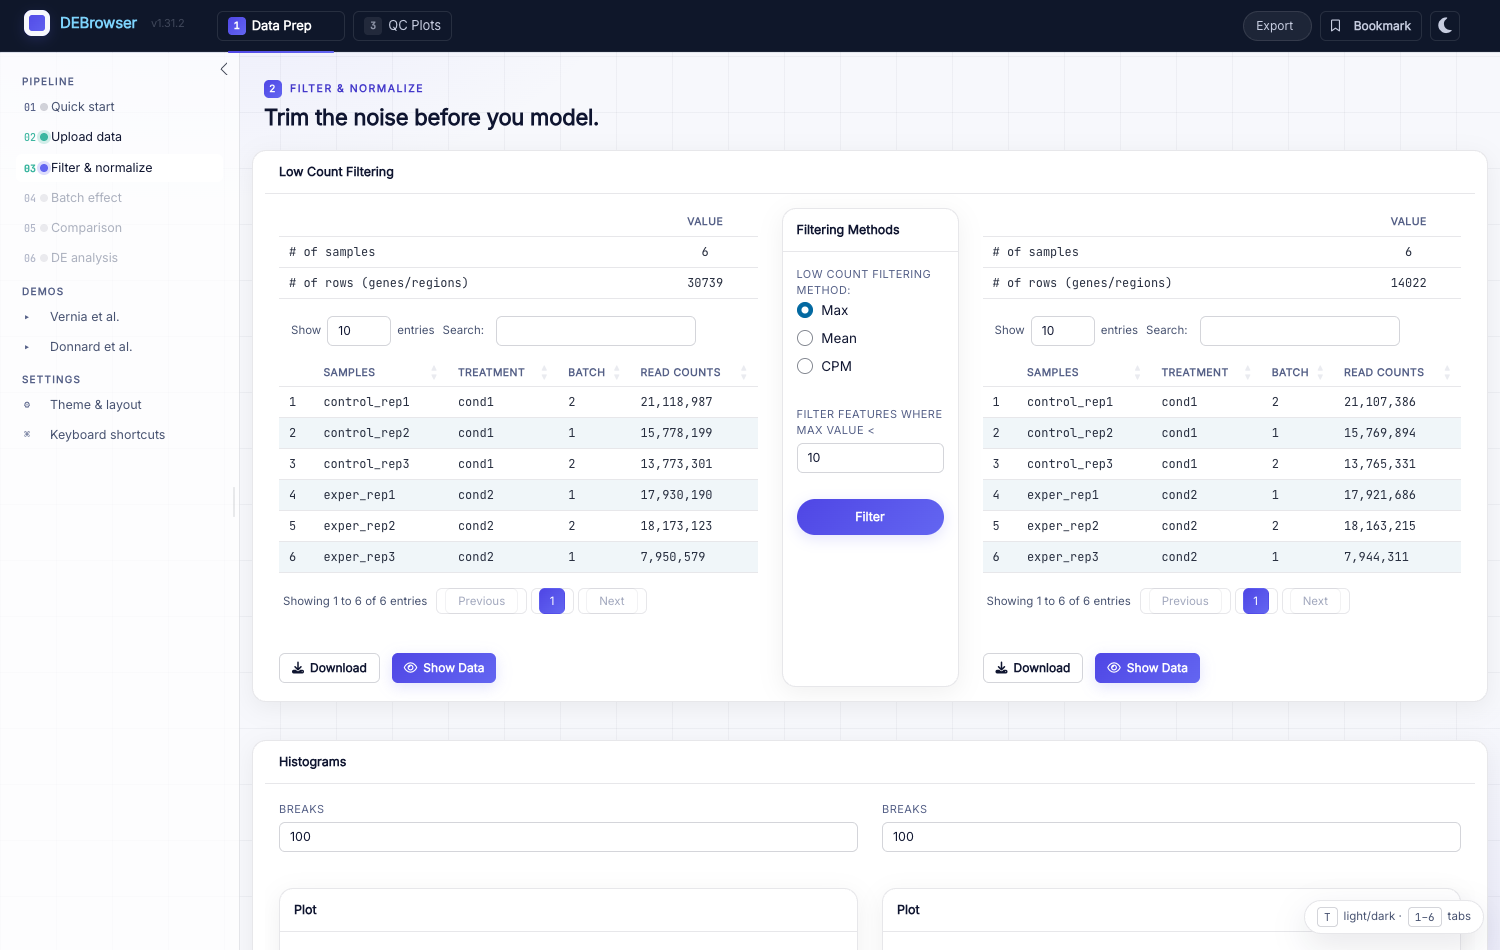
Trim low-signal features with Max, Mean, or CPM filtering. Row counts before and after are shown side by side, with per-sample histograms.
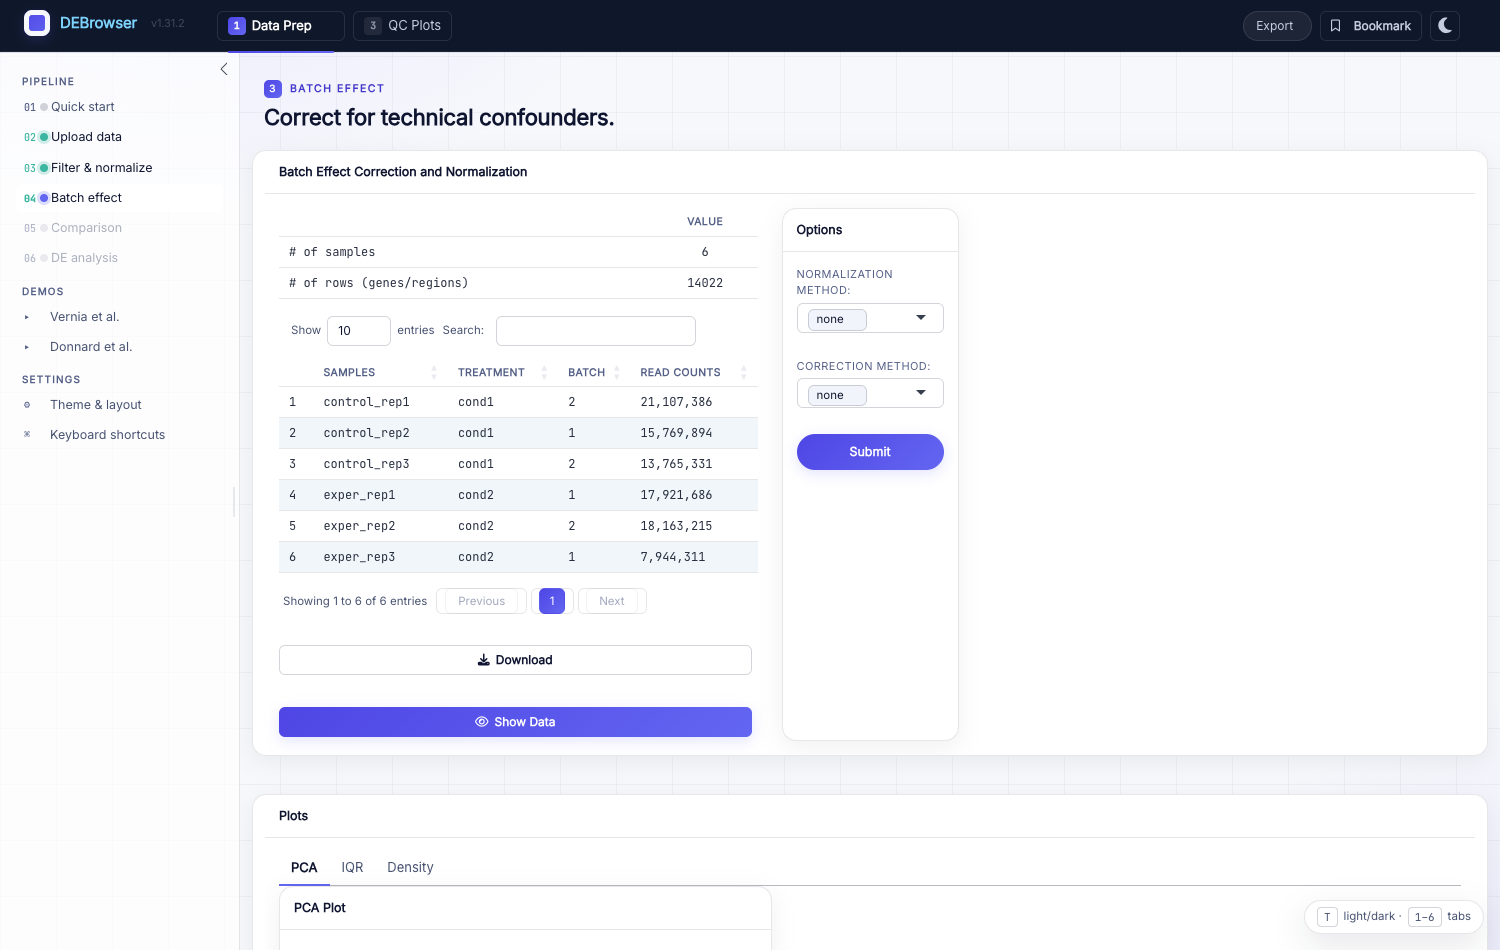
Choose a normalization (MRN, TMM, RLE, upperquartile) and a correction method (ComBat, ComBat-Seq, Harman). Inline PCA / IQR / Density plots — Before vs. After — confirm samples cluster by biology, not batch.
Define one or more contrasts by assigning samples to each side. Each becomes its own DE result set you can switch between.
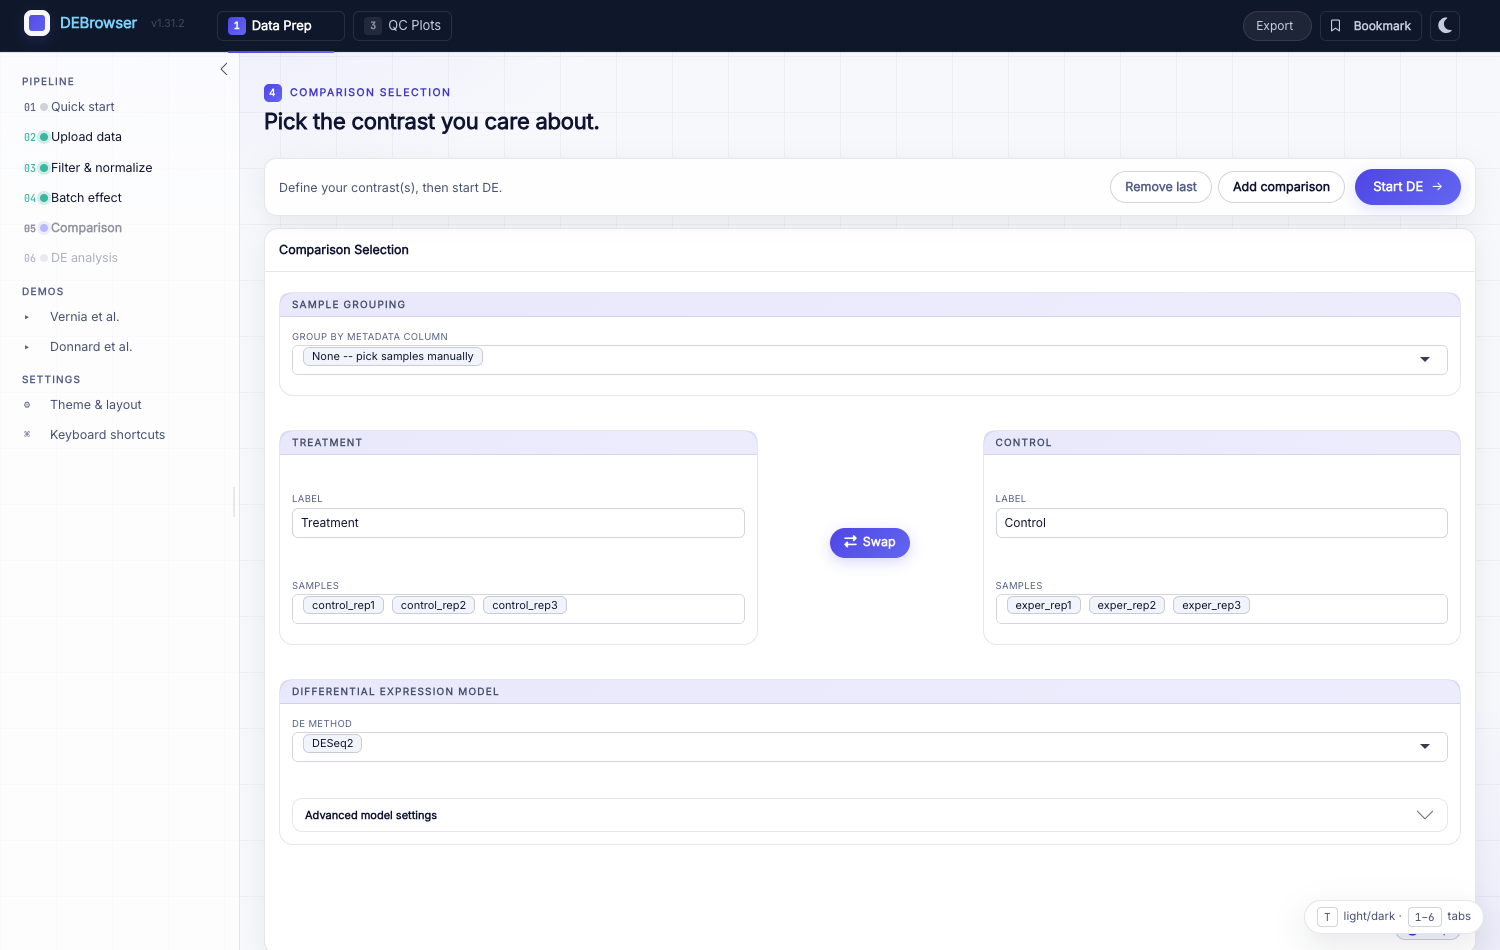
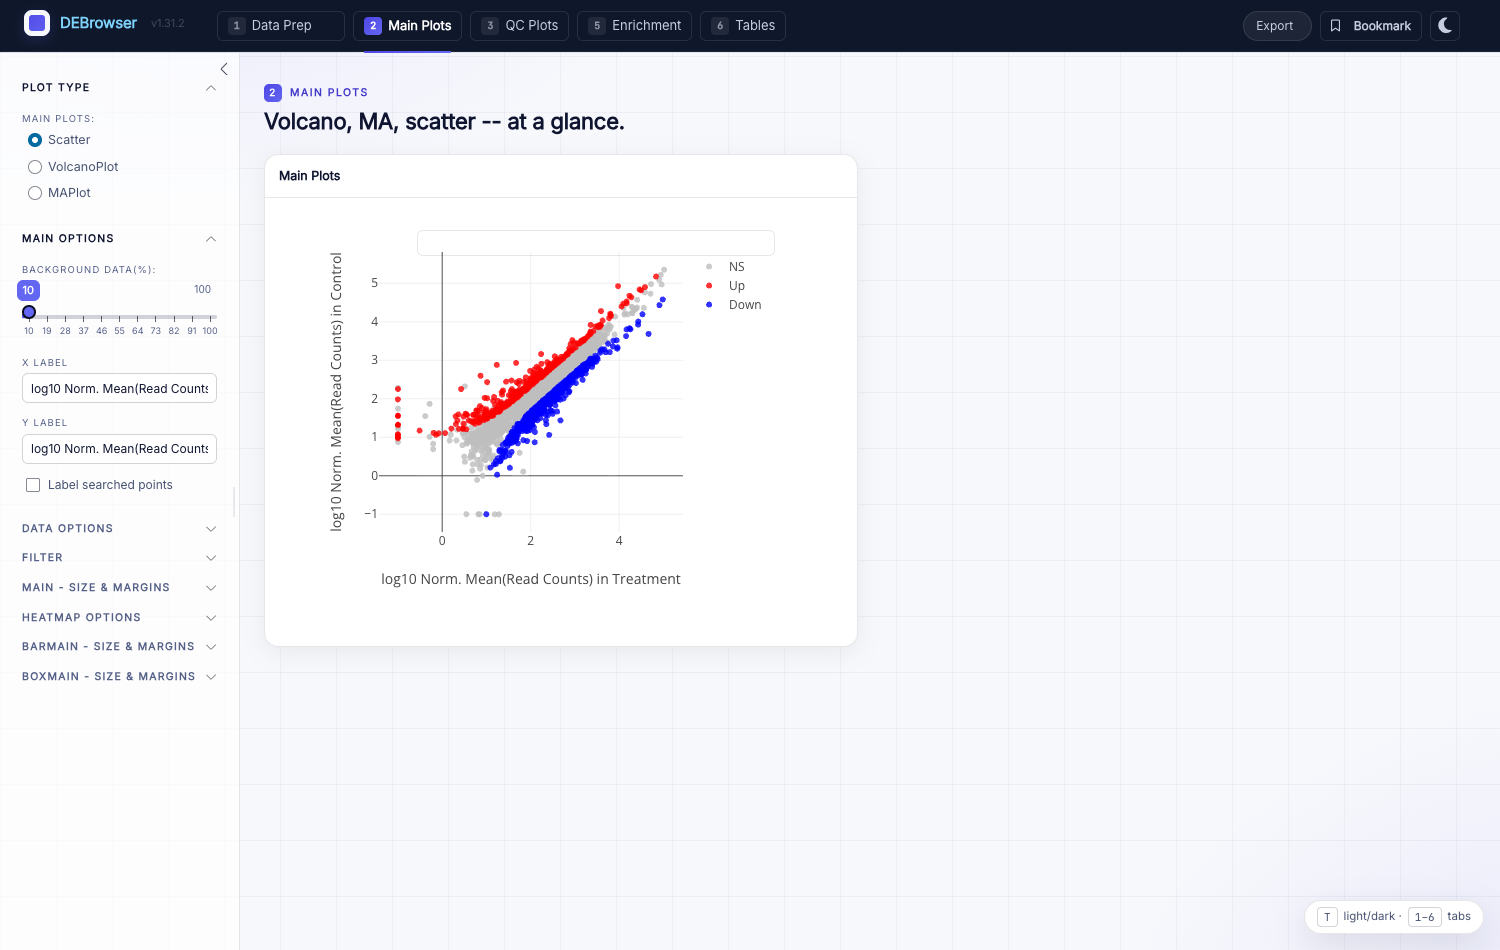
Start DE runs the analysis (progress is reported in stages) and opens
Main Plots. Genes are colored Up (red), Down (blue), NS (grey) per your
padj and log2-fold-change cutoffs; every change is instant.
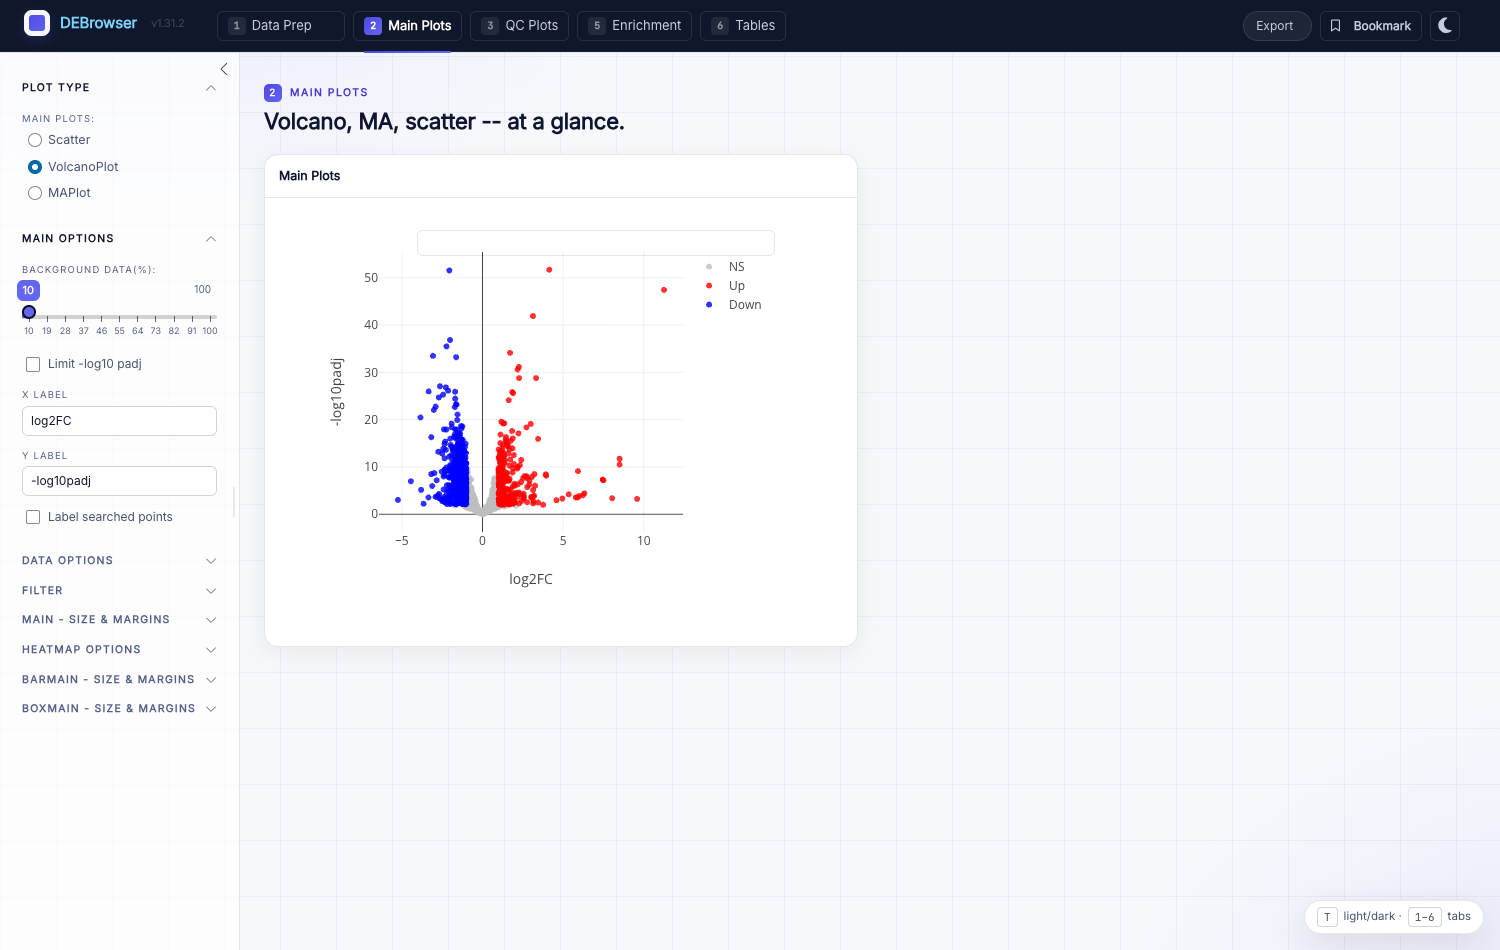
Switch to the Volcano or MA view with the same controls; lasso- or box-select a region to spawn a linked heatmap of just those genes.
enrichGO, enrichKEGG, Disease,
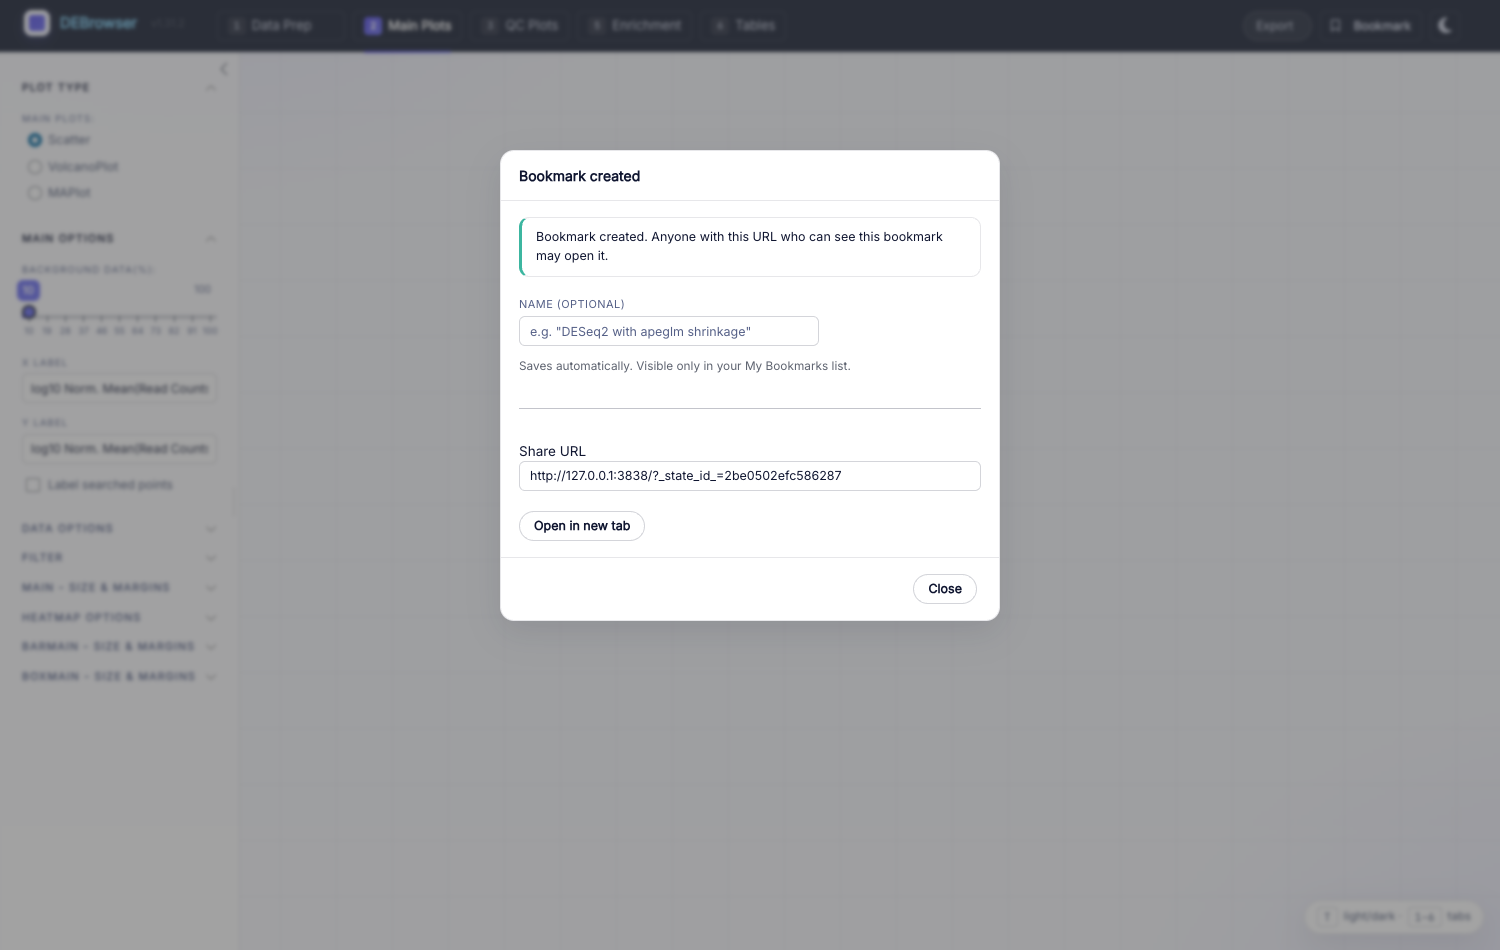
compareCluster) and GSEA against MSigDB, with a NES heatmap.The Export menu turns your interactive session into an R script, R Markdown / HTML, a Jupyter notebook, or a methods paragraph for your manuscript. The Bookmark button captures the entire analysis state behind a stable, shareable URL.
DEBrowser can summarize the biology of a GSEA gene set on the Enrichment tab.
It is off by default — no network calls until you enable it and configure a
provider (Anthropic, OpenAI, or local Ollama). Per-call privacy
modes control what leaves your machine; API keys are stored in your OS keychain
via keyring, never in plaintext.
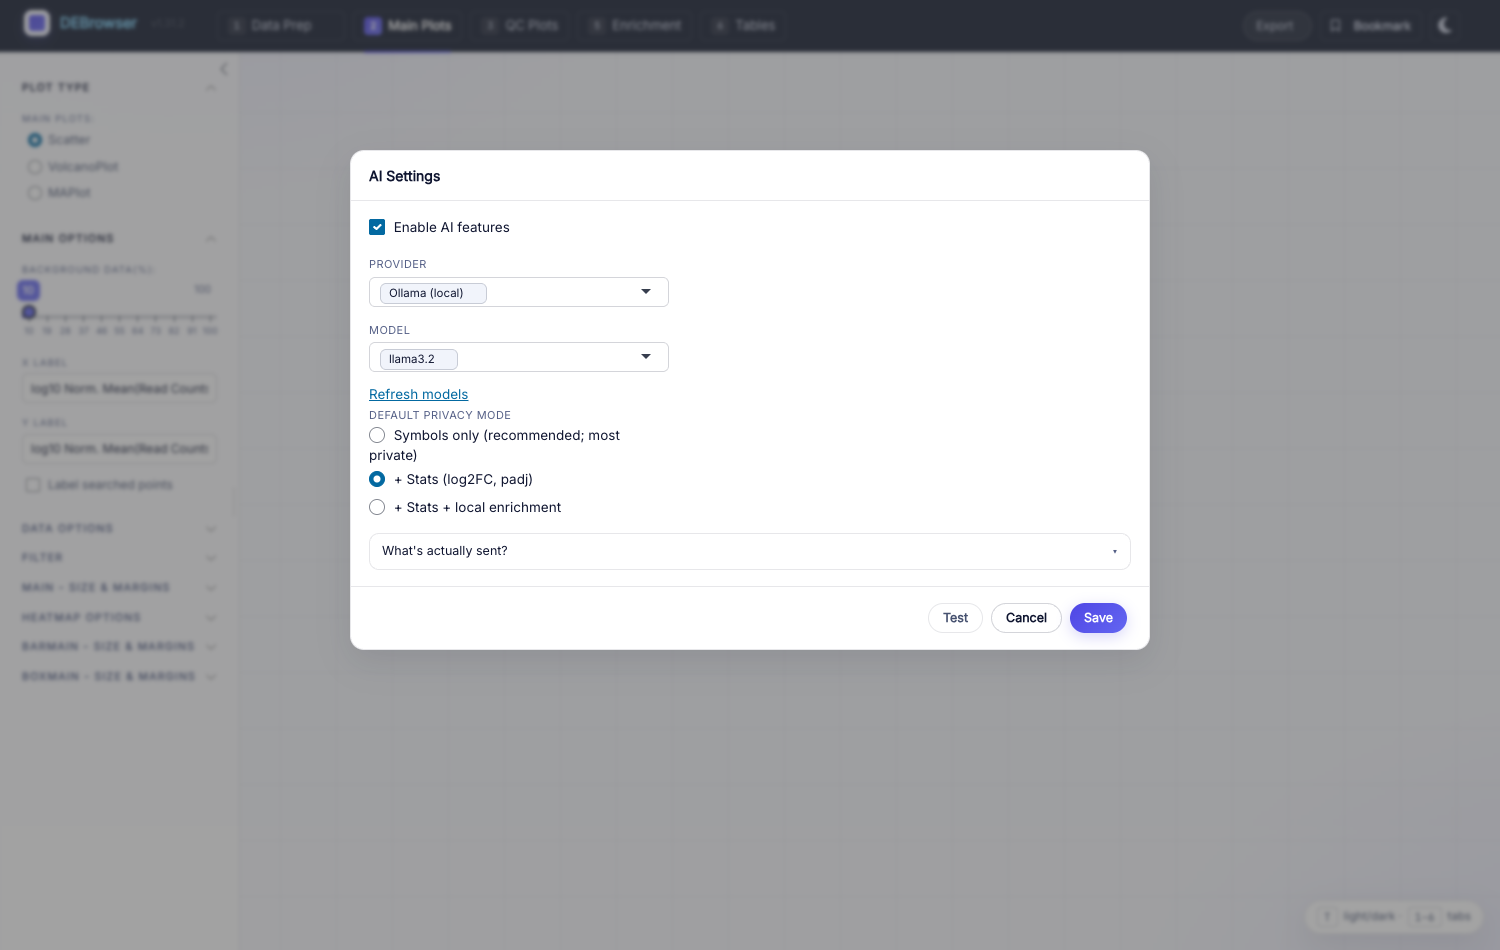
Install the AI extras once: install.packages(c("ellmer", "whisker", "keyring")).
DEBrowser ships a self-contained visual redesign layer. Contributors editing
the UI should read DESIGN.md (the token vocabulary + editing
rules) and open the live component gallery with debrowser::de_style_guide().
Full rationale: docs/design/.
openssl-devel libxml2-devel libcurl-devel libpng-devel
sudo apt-get install libcurl4-openssl-dev libssl-dev libxml2-dev libudunits2-dev
vignette("DEBrowser"), or the
Bioconductor page.DESIGN.md,
docs/design/.If you use DEBrowser in your research, please cite:
Kucukural A, Yukselen O, Ozata DM, Moore MJ, Garber M. DEBrowser: interactive differential expression analysis and visualization tool for count data. BMC Genomics 2019, 20:6. doi: 10.1186/s12864-018-5362-x
GPL-3 (see LICENSE).