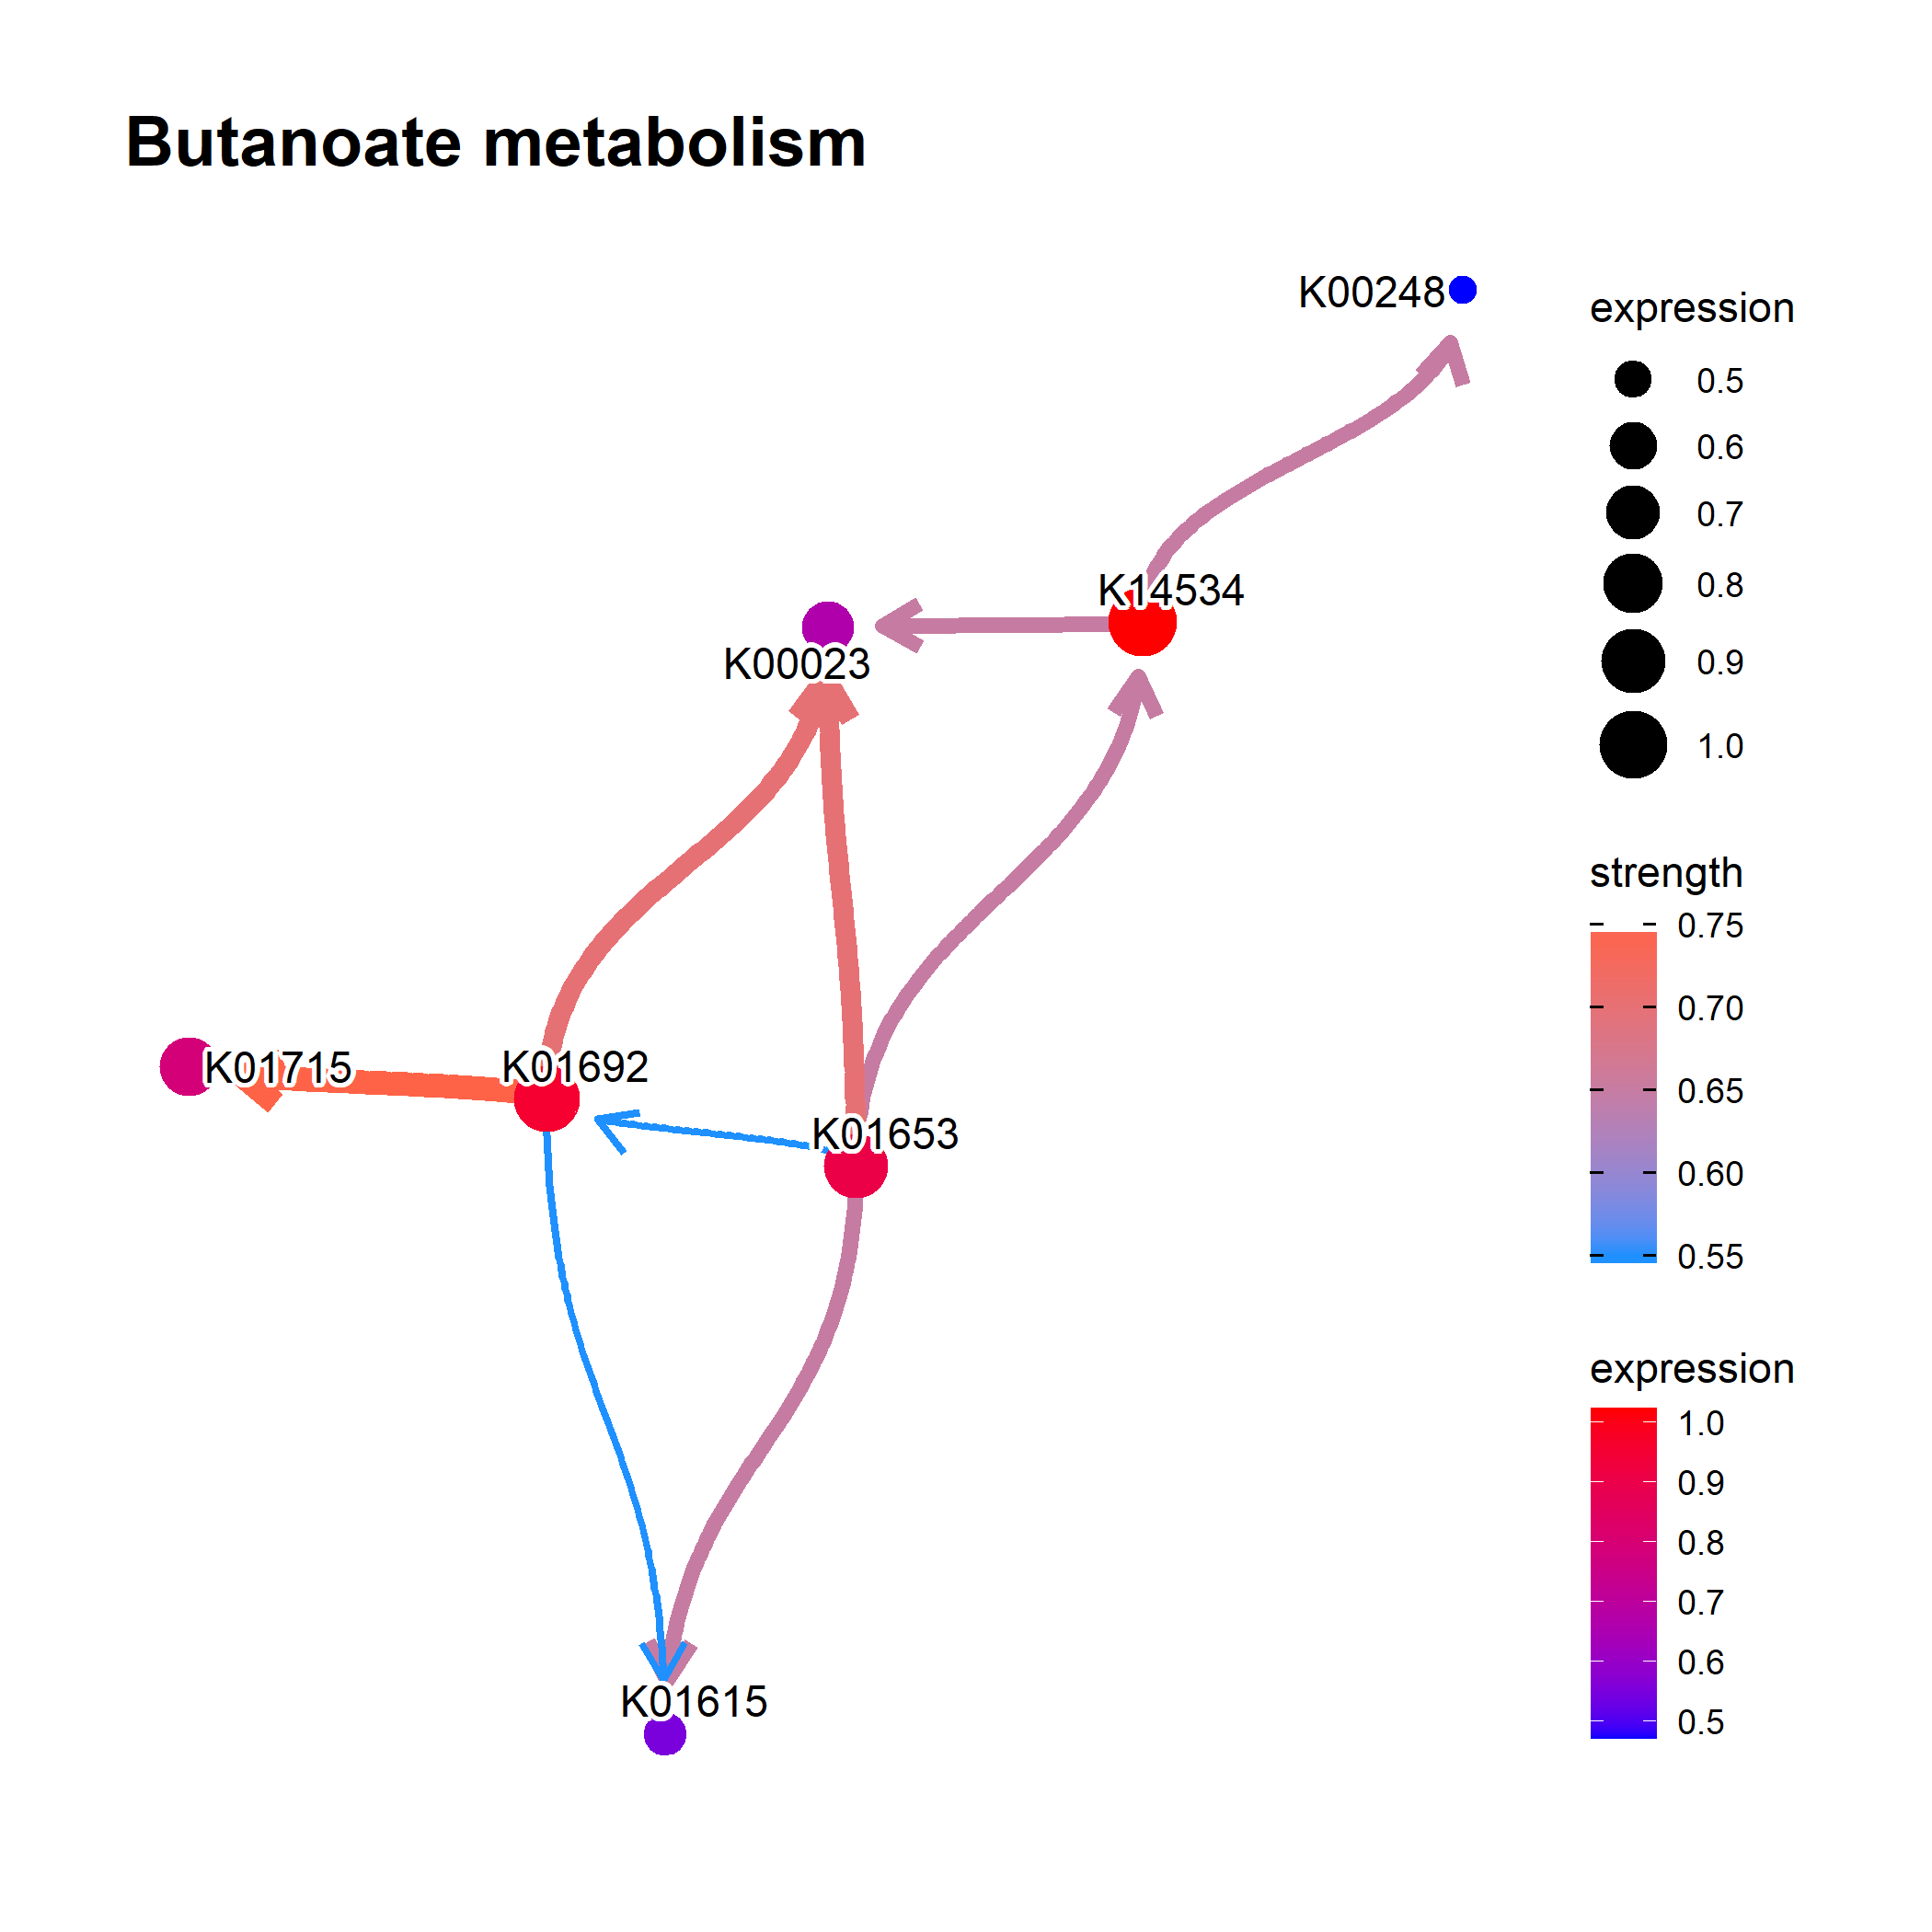
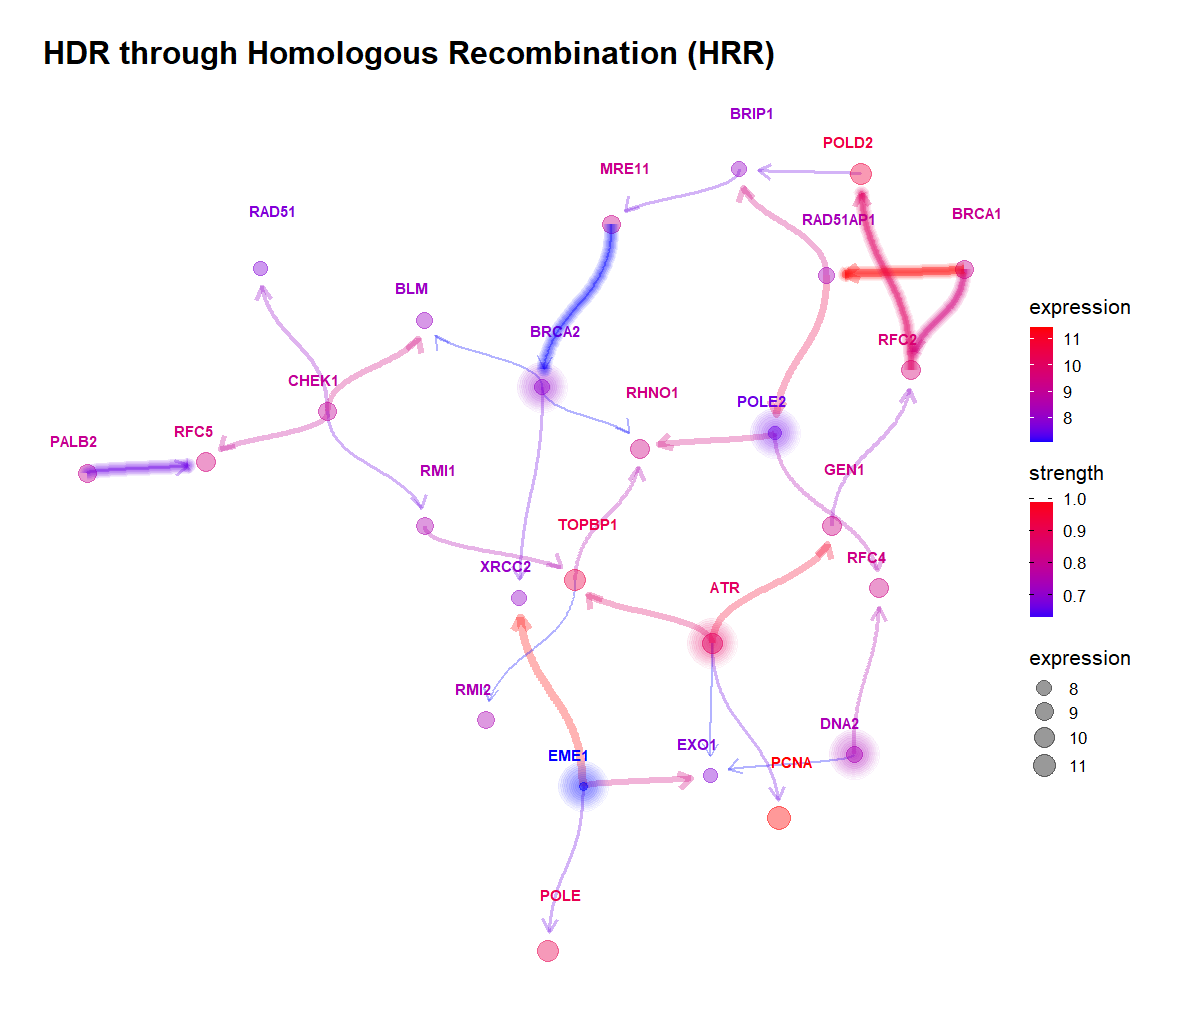
Plot bayesian network inferred from expression data based on the enrichment analysis results from libraries including clusterProfiler and ReactomePA using bnlearn.
BiocManager::install("CBNplot")
library(devtools)
install_github("noriakis/CBNplot")

MicrobiomeProfiler, thanks to the fix by @xiangpin.library(MicrobiomeProfiler)
data(Rat_data)
ko.res <- enrichKO(Rat_data)
exp.dat <- matrix(abs(rnorm(910)), 91, 10) %>% magrittr::set_rownames(value=Rat_data) %>% magrittr::set_colnames(value=paste0('S', seq_len(ncol(.))))
exp.dat %>% head
library(CBNplot)
bngeneplot(ko.res, exp=exp.dat, pathNum=1, orgDb=NULL)